90 Days of Trading, Day 1: What is swing trading and how does it differ from day trading?

90 Days of Trading, Day 1: What is swing trading and how does it differ from day trading?

90 days of trading starts today, post 1/90. Please help us get the word out by sharing! Swing trading is a trading strategy that involves holding positions for a period of a few days to several weeks, in an attempt to profit from price swings in financial markets. The goal of swing trading is to identify the beginning and end of a trend and capture gains from the price swings that follow. Swing trading is different from day trading, which involves holding positions for a very short period of time, usually just for a few hours or even just a few minutes. Day traders aim to profit from the small price fluctuations that occur throughout the day, and they close out their positions at the end of each trading day. One key difference between swing trading and day trading is the holding period. Swing traders tend to hold positions for a longer period of time, while day traders hold positions for a very short period. This means that swing traders may be more exposed to the risks of holding positions overnight or over the weekend, while day traders do not face this risk. Another difference between the two strategies is the level of activity and the number of trades made. Day traders tend to make many trades in a single day, while swing traders may make only a few trades over the course of a week or a month. In general, swing trading may be suitable for traders who have a medium-term outlook and are comfortable with holding positions for a longer period of time. Day trading, on the other hand, may be more suitable for traders who have a shorter-term outlook and are comfortable with the fast-paced nature of the markets.

90 Days of Trading, Day 3: Choosing the right trading platform and broker.

90 Days of Trading, Day 3: Choosing the right trading platform and broker.

Join us on day 3 out of our 90 Day Trading journey! We're just getting started and have some exciting topics lined up for new and experienced traders. Share this with your friends who may be interested in learning more about trading and growing their skills with us! When choosing a trading platform and broker, it's important to consider a few key factors: • Fees: Look for a broker with low fees for trades, especially if you plan to trade frequently. Some brokers may also charge annual or monthly fees, so be sure to factor these in as well. •Trading tools and features: Consider the tools and features that are important to you, such as charting software, market data, scanners, and research reports. Make sure the platform you choose offers the tools and features you need to make informed trading decisions. •Account minimums: Some brokers may have account minimums that you must meet in order to open an account. Consider whether the minimums are realistic for your trading goals and budget. •Customer service: It's important to choose a broker with good customer service, in case you have any questions or issues with your account. Look for brokers that offer multiple channels for support, such as phone, email, and live chat. •Regulation: Make sure the broker you choose is regulated by a reputable financial authority, such as the Financial Conduct Authority (FCA) in the UK or the Securities and Exchange Commission (SEC) in the US. This can help ensure the broker is operating legally and transparently. It's also a good idea to do your own research and read reviews from other traders before choosing a broker. This can help you get a sense of the broker's reputation and the experiences of other traders.

90 Days of Trading, Day 2:  Developing a trading plan.

90 Days of Trading, Day 2: Developing a trading plan.

Creating a day trading plan can help you stay organized and focused, and can increase your chances of success as a day trader. Here are some steps you can follow to create a day trading plan: * Set clear goals: What do you want to achieve with your day trading? Do you want to make a certain amount of money, or do you have a specific financial goal in mind? * Define your trading strategy: How will you approach the markets? Will you focus on a particular asset class or market sector? Will you use technical analysis or fundamental analysis to make trading decisions? * Set risk management rules: It's important to have clear guidelines for managing risk when day trading. This can include setting stop-loss orders, limiting the amount of capital you are willing to risk on any given trade, and taking breaks when necessary to avoid emotional decision making. * Establish a routine: Develop a consistent routine for researching and analyzing the markets, placing trades, and reviewing your performance. * Keep a trading journal: Documenting your trades and analyzing your performance can help you identify areas for improvement and adjust your strategy as needed. Remember, day trading is a high-risk activity and it's important to be prepared and to approach it with caution. It's also important to educate yourself and develop a solid understanding of the markets before starting to trade. Market Jungle is a powerful online trade journal. Sign up today to flatten your learning curve, and start trading the right way.

90 Days of Trading, Day 4: What is Technical analysis

90 Days of Trading, Day 4: What is Technical analysis

Technical analysis is a method of evaluating securities by analyzing statistics generated by market activity, such as past prices and volume. It is based on the idea that market trends, as shown by charts and other technical indicators, can predict future activity. To perform technical analysis on stocks, you can follow these steps: Choose the stock you want to analyze. Obtain a chart of the stock's price and volume activity over a relevant period of time. This could be a daily, weekly, or monthly chart, depending on your trading strategy and the stock's volatility. Day traders typically focus on 1,5,15,30 minute and 1 hour charts where as swing traders tend to analyze higher timeframes. Identify key chart patterns, such as head and shoulders, triangles, and trend lines. These patterns can provide important clues about the stock's likely future price movements. Use technical indicators to help confirm your analysis. These indicators, such as moving averages and relative strength index, are mathematical calculations based on the stock's price and volume data. Make a prediction about the stock's likely future price movement based on your analysis, and consider using a stop-loss order to limit potential losses if your prediction does not come to fruition. Log your trades with Market Jungle, tag the pattern, market conditions, and your analysis. Learn what actually works and what doesn't to grow confidence in your system and trade ideas! It's important to note that technical analysis is just one approach to evaluating stocks, and it should not be relied upon exclusively. It's always a good idea to also consider fundamental analysis, which looks at a company's financial health and industry conditions, as well as other factors, before making any investment decisions.

90 Days of Trading, Day 5: Understanding market trends and patterns

90 Days of Trading, Day 5: Understanding market trends and patterns

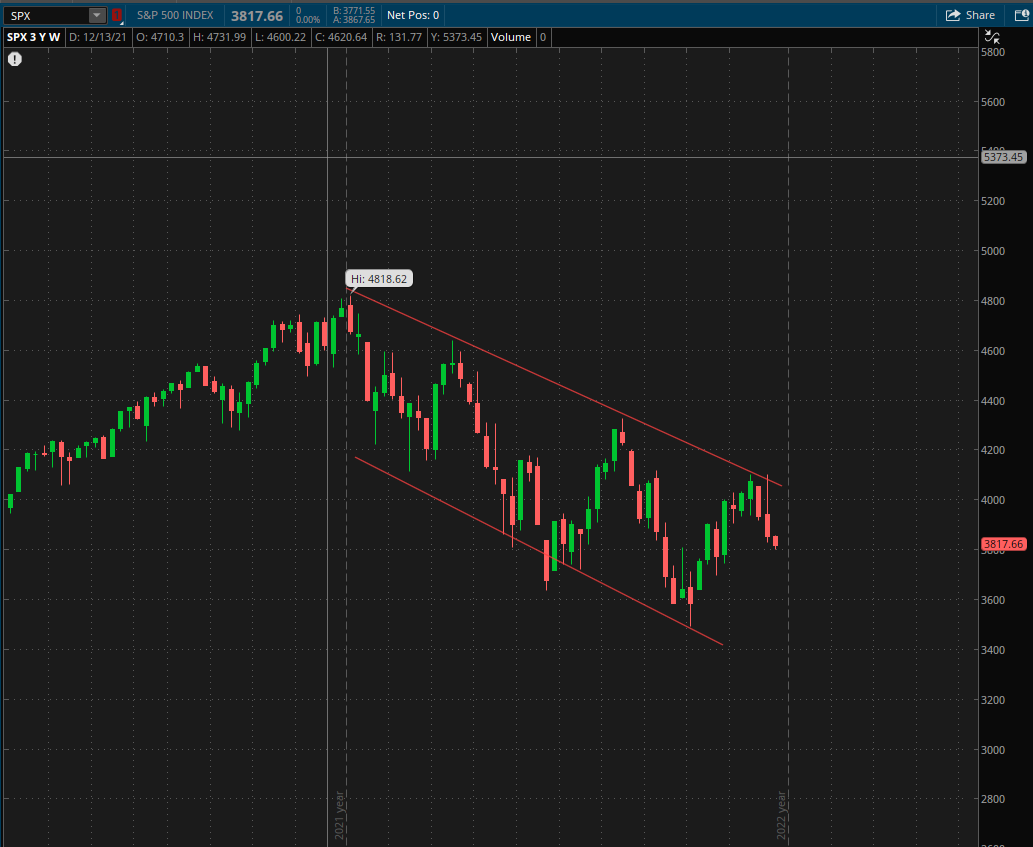
Understanding market trends and patterns can be a valuable tool for traders, as it can help inform trading decisions and identify potential opportunities. Here are some ways to understand market trends and patterns: Look at price charts: Price charts are a visual representation of a security's price over time. By studying price charts, you can identify trends, such as an overall upward or downward movement, as well as patterns, such as head and shoulders or cup and handle formations. An uptrend can be determined by price action making higher highs and higher lows. A down trend can be determined by price action making lower lows and lower highs. Drawing a strait line connecting the highs and lows will define your "trendline" which is something we watch to see if it is respected or broken. Use technical analysis: Technical analysis is a method of evaluating securities by analyzing statistical trends gathered from trading activity, such as past prices and volume. Technical analysts use tools like moving averages and oscillators to identify trends and patterns in the market. Trading is like looking in a rear view mirror, you are always looking at history to model the market, and then trying to predict the future based on what statistically happened in the past. If you are trading on a higher timeframe, monitor economic indicators: Economic indicators, such as GDP, unemployment rate, and inflation, can have a significant impact on the market. By monitoring these indicators, you can get a sense of the overall direction of the economy and how it may impact different sectors and industries. Follow news and market commentary: Staying up-to-date on market news and analysis can help you understand the forces driving market trends and patterns. This can include following financial news outlets, reading industry reports, and listening to analysts and experts in the field. It's important to note that market trends and patterns can be unpredictable and can change over time. As such, it's important to use multiple sources of information and to remain flexible in your approach to trading.

90 Days of Trading, Day 6: Understanding market trends and patterns

90 Days of Trading, Day 6: Understanding market trends and patterns

Up until today we have been laying groundwork with our posts. One thing we have not mentioned is the need for charting software and tools. These can be useful for day traders, as they can provide a way to perform technical analysis and see real time charts. Here are some ways that charting software and tools can be used for day trading: Identify trends and patterns: Charting software allows the user to draw on the charts to indicate where trendlines are, support and resistance, pull backs, as well as classical patterns. The software saves your analysis for future reference. Track market movements: Charting software can be used to track the movements of individual securities or indexes over time. Many times, traders trade in a bubble. This impacts performance. Traders should be following the market and sectors to understand the impact they have on a particular security. The market is your friend, trade in the same direction as it. Another analogy is a rising tide makes all the boats float. Use technical indicators: Many charting software programs include a range of technical indicators that can be used to analyze market trends and patterns. These indicators, such as moving averages and oscillators, can help you identify potential entry and exit points for trades. Keep in mind, technical indicators are lagging indicators based on price and volume. Set alerts: Many charting software programs allow you to set alerts for specific price levels or technical indicators. This can help you stay on top of market movements and take action when certain conditions are met. Alerts can also be setup for different patterns as well as strategies. Scanners/Strategies: Charting software typically has the ability to scan the market for a certain criteria. Many also have the ability to apply strategies to a chart that mark buying and selling areas to help create consistency! It's important to note that charting software is only one tool in a day trader's toolkit, and it should be used in conjunction with other sources of market analysis and information.

90 Days of Trading, Day 7: Support and Resistance

90 Days of Trading, Day 7: Support and Resistance

Support and resistance levels are price levels at which the price of a financial asset is likely to find support as it falls or encounter resistance as it rises. These levels can be identified by looking at chart patterns and past price action. Support levels are typically below the current price of an asset and are seen as a level where buying interest is likely to emerge, leading to a bounce in the price. This is because buyers may see the asset as being undervalued at the support level and be willing to buy it. Resistance levels are typically above the current price of an asset and are seen as a level where selling interest is likely to emerge, leading to a slowdown or reversal in the price. This is because sellers may see the asset as being overvalued at the resistance level and be willing to sell it. There are several ways to identify support and resistance levels, including: * Identifying horizontal price levels: These are levels where the price has repeatedly found support or resistance in the past. * Using trend lines: These are lines drawn on a chart connecting a series of highs or lows and can act as support or resistance levels. * Using moving averages: These are lines plotted on a chart that smooth out price action over a set period of time and can act as support or resistance levels. * Identifying round numbers: These are price levels that end in 00 or 50 (e.g. $50, $100, $150) and can often act as psychological support or resistance levels. It's important to note that support and resistance levels are not fixed and can change over time as market conditions change. It's also worth noting that the price of an asset may break through a support or resistance level, which can signify a change in trend.

90 Days of Trading, Day 8: Risk Management

90 Days of Trading, Day 8: Risk Management

Risk management is an important aspect of day trading. You cannot trade successfully without a robust risk management plan. Some ways to manage risk while day trading include: Setting stop-loss orders: A stop-loss order is a type of advanced order that automatically sells a stock when it reaches a certain price. This can help limit potential losses if the stock moves in the opposite direction to what you expected. Diversifying your portfolio: Don't put all your eggs in one basket. By diversifying your portfolio, you can reduce the overall risk of your investments. Using risk-management tools: Many day-trading platforms offer tools and features that can help you manage risk, such as position sizing calculators and risk/reward ratio analysis. Trading within your risk tolerance: It's important to only trade with money that you can afford to lose, and to trade within your risk tolerance. Don't take on excessive risk in an attempt to maximize profits. Personally, we use Kelly's Formula to help us define our risk. I risk anywhere between a half of percent to one percent depending on market conditions on each trade. Using Kelly's formula, this scales with my account up or down. Keeping emotions in check: Emotional trading can lead to poor decision-making and increased risk. It's important to stay calm and disciplined, and to avoid letting your emotions dictate your trades. Create rules around daily stop amounts, if you lose or win so much in a day, consider the day complete. Create rules around how many trades per day you can take Create rules around how you will manage your stops after entering a trade, will you trail at all? will you move to break even after taking a partial? Leverage Market Jungle's statistics to track your risk metrics, and our journal and emoji tracking to document your emotions to help you become aware of them to learn how to manage them. By following these guidelines, you can help manage risk and protect your capital while day trading. However, it's important to note that day trading carries a high level of risk and is not suitable for everyone. You should always do your own research and consult a financial advisor before making any investment decisions.

90 Days of Trading, Day 9: Understanding Different Order Types

90 Days of Trading, Day 9: Understanding Different Order Types

In the financial markets, an order is a request to buy or sell a security at a specific price. Different order types allow traders to specify the conditions under which their orders should be executed. Here are a few common order types: • Market order: A market order is an order to buy or sell a security at the current market price. Market orders are typically filled immediately, but the price at which the trade is executed may not be the exact price the trader intended. • Limit order: A limit order is an order to buy or sell a security at a specific price or better. The trade will only be executed at the specified price or a better price. A buy limit order can only be filled at the limit price or lower, while a sell limit order can only be filled at the limit price or higher. • Stop order: A stop order, also known as a stop-loss order, is an order to buy or sell a security when it reaches a certain price. A stop order becomes a market order once the specified price is reached. • A buy stop order is placed above the current market price and is typically used to limit a loss or protect a profit on a short sale. A sell stop order is placed below the current market price and is typically used to limit a loss. • Stop limit order: A stop limit order is a combination of a stop order and a limit order. It becomes a limit order when the specified stop price is reached. The trade will only be executed at the limit price or better, but there is no guarantee that the trade will be filled. A few other order types that are more complex are • OCO order: "one cancels the other" order, is a type of order that combines two separate orders into one. The order consists of a primary order and a secondary order, and if one of the orders is executed, the other order is automatically cancelled. OCO orders are often used to set stop-loss and take-profit orders at the same time, or to enter and exit a position in the market with a single order. If using an OCO order, and the target gets hit, the stop is automatically canceled since your position is closed. If the stop gets hit first, then the target is automatically candled. • Iceburg order: An iceberg order is a type of order in which only a small portion of the total order is displayed on the public order book, with the remainder of the order hidden. Iceberg orders can be used to mask the true size of an order and prevent other traders from reacting to the order. It's important to understand the differences between these order types and how they can be used in different market conditions. It's also a good idea to discuss your trading goals and strategies with your broker or trading group/mentor to determine the best order type for your needs.

90 Days of Trading, Day 10: Understanding Technical Analysis

90 Days of Trading, Day 10: Understanding Technical Analysis

Technical analysis is a method of evaluating securities by analyzing statistics generated by market activity, such as past prices and volume, indicators, patterns, and volatility. Technical analysts do not attempt to measure a security's intrinsic value, but instead use charts and other tools to identify patterns that can suggest future activity. Technical analysis is often used by day traders, who buy and sell securities within the same trading day, in an attempt to profit from short-term price movements. There are various technical indicators that traders can use to help make decisions about when to buy and sell securities. Some common technical indicators include moving averages, Bollinger bands, and the relative strength index (RSI). • Moving averages are used to smooth out price data and help identify trends by reducing noise. They are calculated by taking the average of a security's price over a certain time period (such as 50 days) and plotting it on a chart. A trader might look for a security's price to cross above its moving average as a buy signal, or for the price to cross below the moving average as a sell signal. • Bollinger bands are plotted on a chart around a security's moving average. They consist of an upper band and a lower band, which are plotted at a standard deviation above and below the moving average. Bollinger bands can help traders identify overbought or oversold conditions, as well as potential trend reversals. • The relative strength index (RSI) is a momentum indicator that measures the magnitude of recent price changes to determine whether a security is overbought or oversold. The RSI is calculated using a formula that compares the magnitude of recent gains to recent losses over a specified time period. A reading above 70 is generally considered to indicate an overbought condition, while a reading below 30 is considered to indicate an oversold condition. Technical analysts don't only use technical indicators, they also measure impulse moves and retracements on historical price action to make assumptions on what will happen in the future. They also use techniques to project the time it will take for price to reach a certain level as well. We will discuss these techniques in more detail in upcoming posts. Furthermore, Technical analysts may not even use indicators for entry exit criteria, rather they may use price action and other methods. Indicators are used in many ways and it is all dependent on how you design your "trade system". Another use for indicators is to help segment market data with scanners. As an example, you can come up with rules to classify stock cycles (Bull, Sideways, Bear) with moving averages, then take the conditions for a bull market and scan all stocks that are in this part of their cycle and overlay this with execution rules. It's important to note that technical analysis is not an exact science and that past performance is not necessarily indicative of future results. Technical analysis should be used in conjunction with fundamental analysis, which looks at a security's underlying value, to make informed trading decisions.

90 Days of Trading, Day 11: Using Moving Averages To Trade With.

90 Days of Trading, Day 11: Using Moving Averages To Trade With.

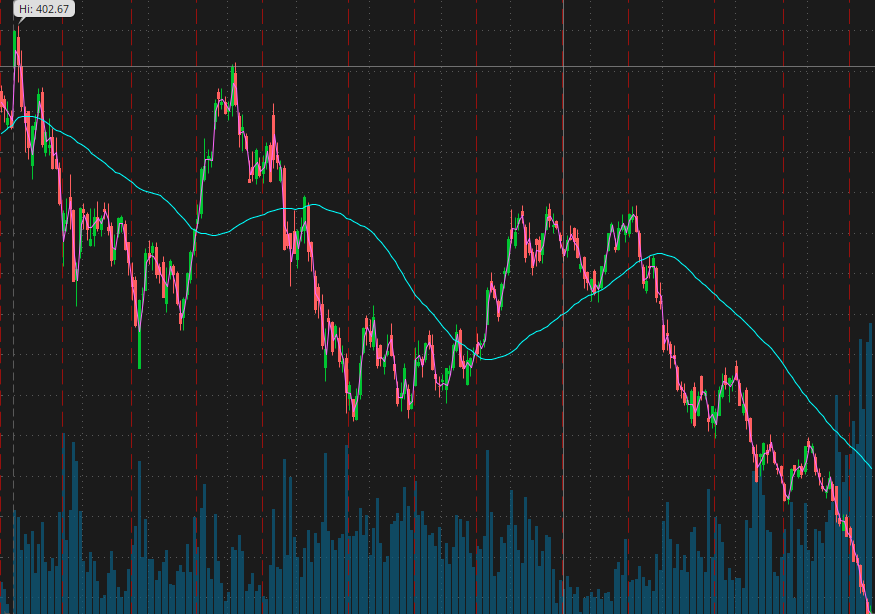
Moving averages are a widely used technical analysis tool that can help traders identify trends and make informed decisions about buying and selling securities. A moving average is a statistical calculation that takes the average price of a security over a certain number of periods, with the most recent periods given the most weight. By plotting a moving average on a chart, traders can get a sense of the underlying trend in the security's price and use it to inform their trading decisions. There are several types of moving averages that traders can use, including simple moving averages (SMAs), exponential moving averages (EMAs), and weighted moving averages (WMAs). The choice of which moving average to use depends on the trader's goals and the characteristics of the security being traded. One common strategy that traders use with moving averages is to buy when the security's price crosses above the moving average, and sell when it crosses below the moving average. This is known as a "moving average crossover" strategy. Another strategy is to use multiple moving averages with different time periods to identify trend changes and potential entry and exit points.
 Another great use of moving averages is to come up with a regime filter. This is a way to classify if the market in bull, bear, or sideways. By having a systematic way of classifying the market regime, when analyzing a strategy, you can segment by market regime to determine how each strategy performs in each condition. Our team takes this approach and leverages Market Jungle to help us segment our trading history by regime. We use the 50, 100, and 200 SMA to help us classify the market regime. It's important to note that moving averages are a lagging indicator, which means that they are based on past price data and may not accurately predict future price movements. Therefore, it is always important for traders to use moving averages in conjunction with other technical and fundamental analysis tools to make informed trading decisions.

90 Days of Trading, Day 12: How to use Market Scanners

90 Days of Trading, Day 12: How to use Market Scanners

Market scanners are a tool that allow traders to search for securities that meet certain criteria, such as price, volume, or technical indicators. Here are some steps for using market scanners: Determine your search criteria: The first step in using a market scanner is to determine the criteria you want to use to search for securities. This may include factors such as price, volume, technical indicators, or fundamental data. As day traders, we typically focus on searching for volume, liquidity, and patterns. We also layer in regime filters to segment out the data properly. The idea behind scanners is to segment market data so you are looking at the same thing over and over. Set up your scanner: Once you have determined your search criteria, you can set up your market scanner to search for securities that meet those criteria. This may involve selecting specific exchanges or markets to search, as well as setting up any filters or alerts you want to use. Run your scan: Once you have set up your market scanner, you can run the scan to search for securities that meet your criteria. The scanner will typically generate a list of securities that match your search, along with any relevant data such as price, volume, and technical indicators. Review the results: Once the scan is complete, you can review the results to identify potential trading opportunities. This may involve analyzing the data provided by the scanner and conducting further research on the securities that appear in the results. Here at Market Jungle, we pair up execution rules with scanners. In other words. In other words, our scanners find the setup, then we execute. We also look at using our scanners to dial in PPS that works best for a strategy, as well as to help classify the regime. Here is an example of a regime filter for Think or Swim. It adds one additional parameter for stocks with their price below the 200 SMA # This filters for stocks below the 200 SMA on the 5 minute chart input price = close; input length = 200; input displace = 0; input showBreakoutSignals = no; def SMA = Average(price[-displace], length); plot scan; scan = SMA > price; It's important to note that market scanners are only one tool in a trader's toolkit, and they should be used in conjunction with other forms of market analysis and research.

90 Days of Trading, Day 13: Trading With Momentum

90 Days of Trading, Day 13: Trading With Momentum

Momentum trading is a strategy in which traders seek to capitalize on the strength of a security's price trend by buying and selling securities that are showing strong momentum. The idea behind momentum trading is that securities that are experiencing strong price momentum are more likely to continue moving in the same direction, so traders can potentially profit by buying into the trend and selling at a higher price. There are several ways to measure momentum, including using technical indicators such as the relative strength index (RSI) or the moving average convergence divergence (MACD) indicator. These indicators use historical price data to identify overbought and oversold conditions, which can help traders identify potential entry and exit points for trades. Traders who use momentum trading strategies often look for securities that are experiencing strong price momentum and relatively high levels of trading volume, as this can be a sign of a well-established trend. However, it's important to keep in mind that momentum can be difficult to predict and can change rapidly, so traders need to be prepared for the possibility of sudden price reversals. As with any trading strategy, it's important to use risk management techniques to protect against potential losses.

90 Days of Trading, Day 14:  Identifying and Trading Breakouts

90 Days of Trading, Day 14: Identifying and Trading Breakouts

A breakout is a price movement through an identified level of support or resistance in a financial market, such as a stock or currency exchange. Traders often watch for breakouts as a potential sign of a change in the market trend or a new trading opportunity. There are a few different ways to identify and trade breakouts: • Identify key levels of support and resistance: These are price levels where the market has historically had difficulty breaking through. By identifying these levels, traders can watch for a breakout to occur. • Use technical analysis: Technical analysis involves looking at chart patterns, such as candlestick patterns or moving averages, to identify potential breakout opportunities. • Use a breakout strategy: A breakout strategy involves setting entry and exit points around a level of support or resistance and then entering a trade when the price breaks through that level. Another strategy is to trade the re-test. Many times, after a breakout, the original breakout point is re-tested. If price re-tests and fails, the probability of the trade is higher. The downside is in strong markets with a lot of momentum, the retracement may not happen and you may miss the opportunity. Another option is to take the initial breakout, and then add on the re-test. Be sure to create your rules ahead of time, and test! It's important to note that breakouts can be volatile and risky, so it's important to use risk management techniques, such as stop-loss orders, to protect against potential losses.

90 Days of Trading, Day 15: Understanding Market Sentiment And Sentiment Indicators

90 Days of Trading, Day 15: Understanding Market Sentiment And Sentiment Indicators

Market sentiment refers to the overall mood or attitude of investors towards a particular market or asset. It is often used to describe the emotional state of the market, with "bullish" sentiment indicating a positive outlook and optimism about future price increases, and "bearish" sentiment indicating a negative outlook and pessimism about future price declines. There are several ways to measure market sentiment, including sentiment indicators and sentiment surveys. Sentiment indicators are statistical tools that use data from the market or financial news to gauge the overall sentiment of market participants. Examples of sentiment indicators include the put-call ratio, the advance-decline line, and the bullish-bearish index. Sentiment surveys involve asking market participants directly about their expectations and attitudes towards the market. These surveys can be conducted online or through phone or in-person interviews. Some popular sentiment surveys include the American Association of Individual Investors (AAII) survey and the Investors Intelligence (II) survey. It is important to note that market sentiment is not always a reliable predictor of future market movements. While sentiment can influence market trends, it is ultimately driven by a variety of factors, including economic conditions, company performance, and investor sentiment.